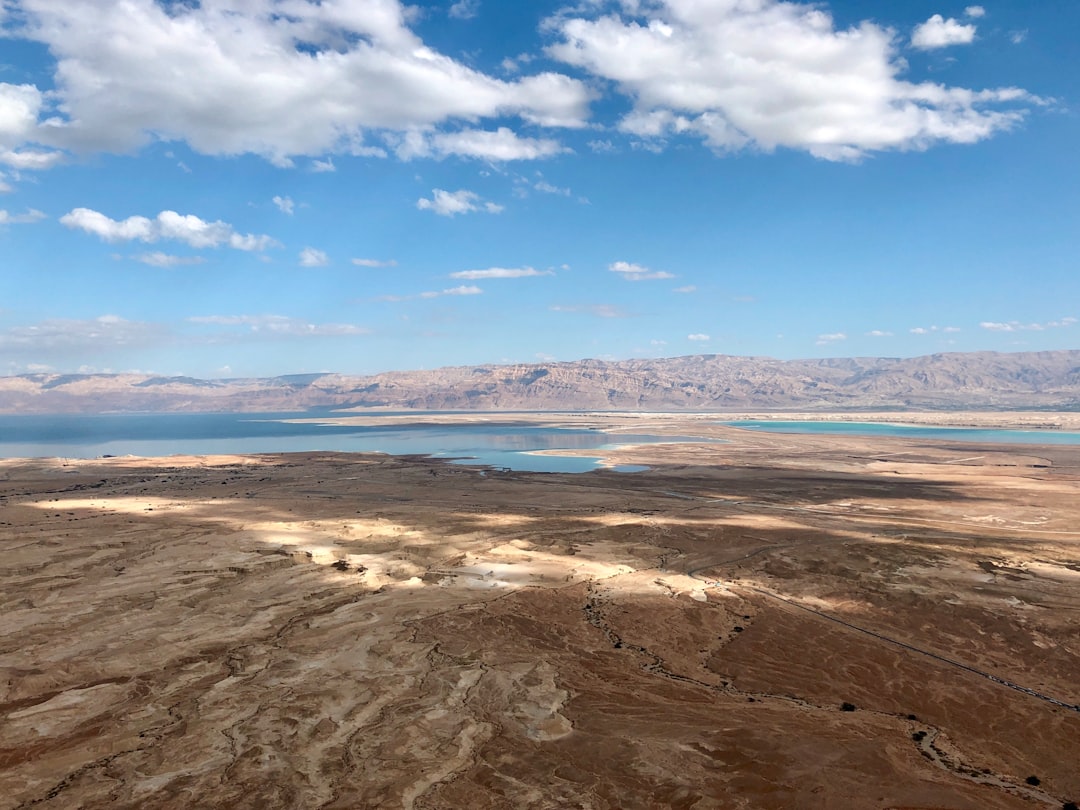
Stunning Dead Sea Satellite Imagery Reveals Unprecedented Detail
A recent surge in high-resolution satellite imagery of the Dead Sea has unveiled a breathtaking level of detail, allowing scientists and environmentalists to observe the region’s complex and rapidly changing landscape with unprecedented clarity. This advanced observational capability is not merely an aesthetic marvel; it represents a critical tool for understanding the profound environmental challenges facing the Dead Sea, a body of water renowned for its hypersalinity and unique geological features. The data gathered is illuminating subtle shifts in water levels, the intricate network of sinkholes forming along its shores, and the impact of ongoing water diversion projects on the surrounding ecosystem.
The receding waterline of the Dead Sea is one of its most visually striking and concerning features, and the new satellite imagery offers a stark and detailed account of this phenomenon. For decades, the Dead Sea has been shrinking at an alarming rate, a consequence of both natural climatic factors and extensive human intervention in its water sources. The latest satellite data allows for a precise measurement of this retreat, offering a visual narrative of the land emerging from the water’s embrace.
Documenting the Water Level Decline
The most immediate and impactful revelation from the new imagery is the precise quantification of the Dead Sea’s declining water levels. Scientists can now track the subtle annual, and even seasonal, fluctuations with centimeter-level accuracy. This granular data is crucial for building more accurate hydrological models, predicting future water levels, and assessing the efficacy of any proposed water management strategies. Previously, such precise measurements were labor-intensive and infrequent. The satellite perspective provides a continuous and consistent record, painting a vivid picture of the water’s persistent retreat. This visual evidence is a powerful advocacy tool, underscoring the urgency of the situation.
Mapping the Exposed Land Bridge
As the water recedes, vast swathes of land, once submerged, are now exposed. The satellite imagery meticulously maps these newly formed land bridges and shorelines. This allows for the study of the geological processes that are being revealed, such as ancient shorelines, mineral deposits, and the unique textures of the exposed lakebed. These features, previously obscured by the water, now offer insights into the Dead Sea’s geological history and the composition of its sediments. The ability to map these areas in detail helps researchers understand the ecological succession that may occur as new terrestrial habitats emerge.
Identifying Seasonal Variations and Anomalies
Beyond the long-term decline, the satellite imagery also captures seasonal variations in the Dead Sea’s surface area and salinity distribution. Subtle changes in evaporation rates, rainfall, and the inflow of water from the Jordan River and other tributaries are now discernible. These anomalies, which might have gone unnoticed with less sophisticated observation methods, are critical for understanding the dynamic equilibrium of the Dead Sea. For example, periods of slightly increased inflow can be visually identified, offering clues about the effectiveness of short-term management efforts or natural climatic variations.
Recent advancements in satellite imagery have provided valuable insights into the environmental changes occurring in the Dead Sea region. For a deeper understanding of how these technologies are being utilized to monitor the shrinking shoreline and the ecological impacts, you can explore a related article at MyGeoQuest. This article delves into the methods and findings of satellite observations, highlighting their significance in addressing the challenges faced by this unique ecosystem.
The Menace of Sinkholes: A Growing Threat Revealed
Perhaps one of the most alarming and visually dramatic phenomena revealed by the enhanced satellite imagery is the proliferation and expansion of sinkholes along the Dead Sea’s western and eastern shores. These sudden geological collapses pose a significant danger to infrastructure, tourism, and local communities. The new imagery provides an unprecedented view of their scale, density, and the patterns of their formation.
Visualizing Sinkhole Clusters and Their Growth
The satellite data allows for the precise mapping of existing sinkhole clusters. Researchers can observe how these clusters are growing, both in terms of individual sinkhole size and the rate at which new ones are appearing. This temporal analysis is invaluable for predicting future hazard zones and implementing preventative measures. The imagery reveals the intricate network of subsurface water flows that are believed to be the primary driver of sinkhole formation, as freshwater dissolves underground salt layers, leading to collapses.
Understanding Subsurface Hydrology Through Surface Features
While sinkholes are surface manifestations, the satellite imagery offers clues about the underlying hydrological processes. Subtle changes in ground surface elevation, variations in vegetation patterns around sinkhole areas, and the visual distinction between different soil and sediment types can all be interpreted to infer subsurface water movement. This allows scientists to develop hypotheses about where future sinkhole activity is most likely to occur, even in areas that currently appear stable.
Impact on Infrastructure and Human Activity
The detailed mapping of sinkholes is crucial for assessing their impact on human infrastructure, including roads, hotels, and industrial facilities. The imagery can highlight areas that are at immediate risk, enabling authorities to implement safety measures, reroute infrastructure, or even initiate relocation efforts. The visual evidence of these dangerous formations is a stark reminder of the environmental pressures on the region and the need for careful land-use planning.
Water Diversion and Its Ramifications: A Clearer Picture
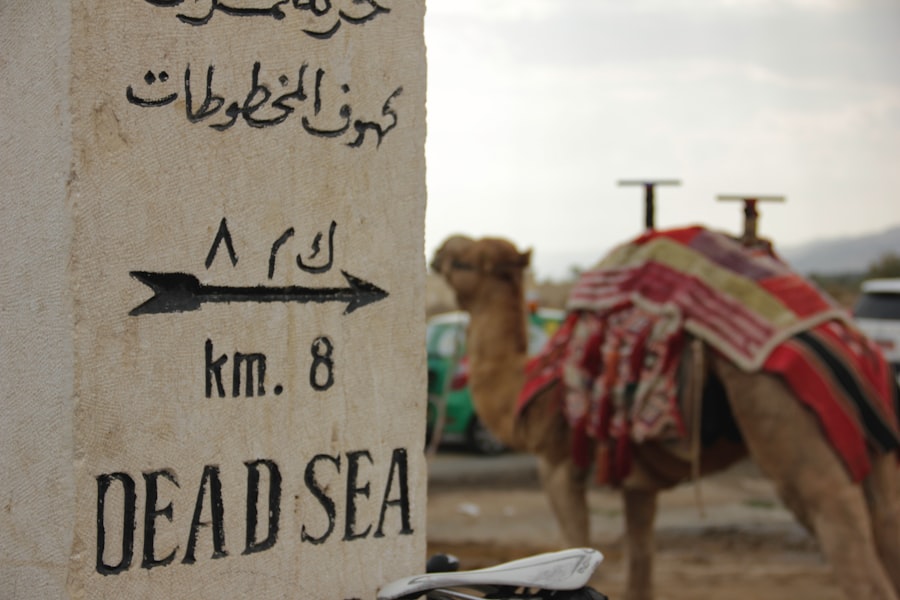
The Dead Sea’s fate is inextricably linked to the management of its primary water sources, particularly the Jordan River. Extensive water diversion projects for agricultural and domestic use by neighboring countries have significantly reduced the inflow of freshwater. The latest satellite imagery provides a more comprehensive understanding of these diversion activities and their direct impact on the Dead Sea’s shrinking volume.
Tracking Water Flow Alterations
By observing the Jordan River and its tributaries, as well as the channels and reservoirs used for water diversion, the satellite imagery allows for a detailed tracking of altered water flow patterns. Scientists can see where water is being extracted, how much is being channeled, and the impact of these diversions on the quantity of water reaching the Dead Sea. This quantitative data is essential for ongoing diplomatic discussions and the development of sustainable water-sharing agreements.
Monitoring Evaporation and Salinity Gradients
The imagery also helps in understanding the impact of reduced freshwater inflow on evaporation rates and salinity gradients within the Dead Sea. As the water level drops, the surface area decreases, leading to increased evaporation per unit area. The satellite data can reveal subtle changes in water surface temperature and reflectance, which are indicative of varying salinity levels. This is important for understanding the survival of the unique extremophile organisms that inhabit the Dead Sea.
Assessing the Impact on Surrounding Wetlands and Estuaries
The reduction in Dead Sea water levels also affects the delicate balance of surrounding wetlands and estuaries that are fed by its waters or interact with its hydrological system. The satellite imagery can document the desiccation of these areas, the changes in vegetation, and the potential impact on biodiversity. This holistic view is vital for understanding the broader ecological consequences of water management decisions.
Geomorphological Transformations: Unveiling the Ancient and the New
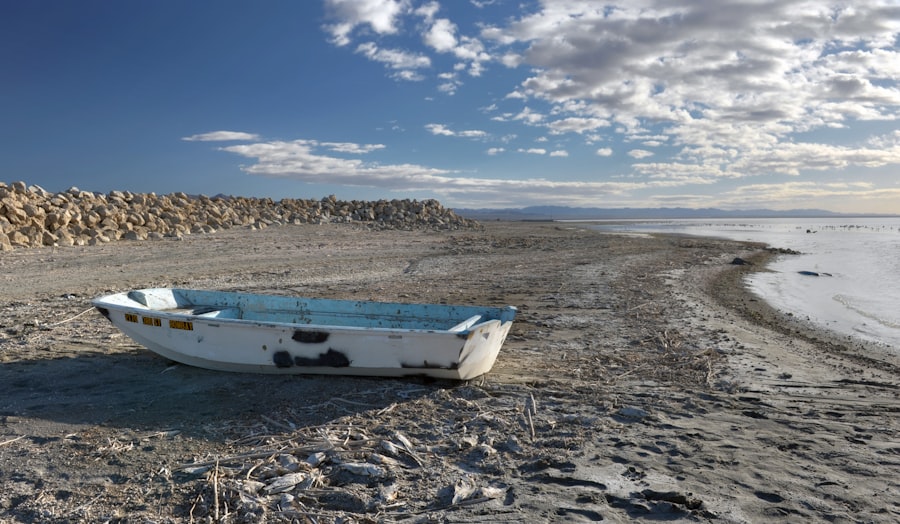
The Dead Sea region is a geologically dynamic area, shaped by tectonic forces and the long-term process of evaporation. The high-resolution satellite imagery is revealing intricate geomorphological features with remarkable clarity, offering new insights into the region’s past and present transformations.
Mapping Ancient Shorelines and Terrace Formations
As the Dead Sea recedes, it exposes ancient shorelines and terrace formations that provide a tangible record of past sea levels. The satellite imagery meticulously maps these features, allowing geologists to reconstruct the history of the Dead Sea and its fluctuations over millennia. These landforms offer clues about past climatic conditions and tectonic activity. The detailed visual data helps in correlating these formations with other geological evidence.
Studying Mineral Deposits and Salt Formations
The Dead Sea is famous for its high salt content and the unique mineral formations that result. The satellite imagery can now distinguish between different types of mineral deposits, including salt crusts, gypsum formations, and other evaporite minerals. This allows for a more detailed study of their composition, distribution, and the processes of their formation and dissolution. The visual patterns can also indicate areas of ongoing chemical reactions.
Analyzing Erosion Patterns and Sediment Transport
The exposed shorelines and the altered hydrological regime are leading to new patterns of erosion and sediment transport. The satellite imagery can track the movement of sediments along the newly exposed lakebed and the impact of wind and water erosion on the surrounding landscape. This information is vital for understanding the long-term stability of the region and potential future environmental changes.
Recent advancements in satellite imagery have provided new insights into the unique geological and environmental characteristics of the Dead Sea region. For those interested in exploring this topic further, an informative article can be found at My Geo Quest, which delves into the implications of these images on our understanding of the area’s changing landscape. This resource highlights how satellite technology is revolutionizing our approach to studying natural phenomena and monitoring environmental changes.
The Future of the Dead Sea: Data-Driven Solutions and Global Implications
| Date | Imagery Source | Resolution | Coverage |
|---|---|---|---|
| January 2021 | Sentinel-2 | 10 meters | Entire Dead Sea area |
| March 2021 | Landsat 8 | 30 meters | Northern Dead Sea region |
| June 2021 | WorldView-3 | 0.31 meters | Specific Dead Sea shorelines |
The unprecedented detail provided by the latest satellite imagery is not just an academic exercise; it is a critical resource for informing future policy and action. The insights gained are crucial for developing effective strategies to mitigate the ongoing environmental crisis and for understanding the broader implications of such large-scale water body degradation.
Informing Conservation and Restoration Efforts
The detailed mapping of the Dead Sea’s current state—its receding shores, its sinkhole-prone areas, and the impact of water diversions—provides the essential baseline data needed for effective conservation and restoration efforts. Scientists can use this information to design targeted interventions, such as managed freshwater inflows or geological stabilization projects, and to monitor their success over time. The visual evidence can also galvanize international support and funding for these critical initiatives.
Enhancing Predictive Modeling and Risk Assessment
By providing highly accurate and consistent data on water levels, salinity, and geological instability, the satellite imagery significantly enhances the accuracy of predictive models. These models are vital for forecasting future scenarios, assessing risks to infrastructure and human populations, and understanding the potential ecological tipping points. This data-driven approach allows for more informed decision-making and proactive planning.
Contributing to Global Water Resource Management Debates
The Dead Sea is not an isolated case. Many of the challenges it faces—water scarcity, over-extraction of resources, and the consequences of climate change—are global in scope. The detailed understanding of the Dead Sea’s plight, made possible by advanced satellite imagery, serves as a crucial case study and a stark warning for other regions facing similar environmental pressures. It highlights the interconnectedness of water resources and the imperative for sustainable management practices on a global scale. The visual evidence of the Dead Sea’s decline is a powerful, undeniable testament to the need for international cooperation and responsible stewardship of our planet’s vital water bodies.
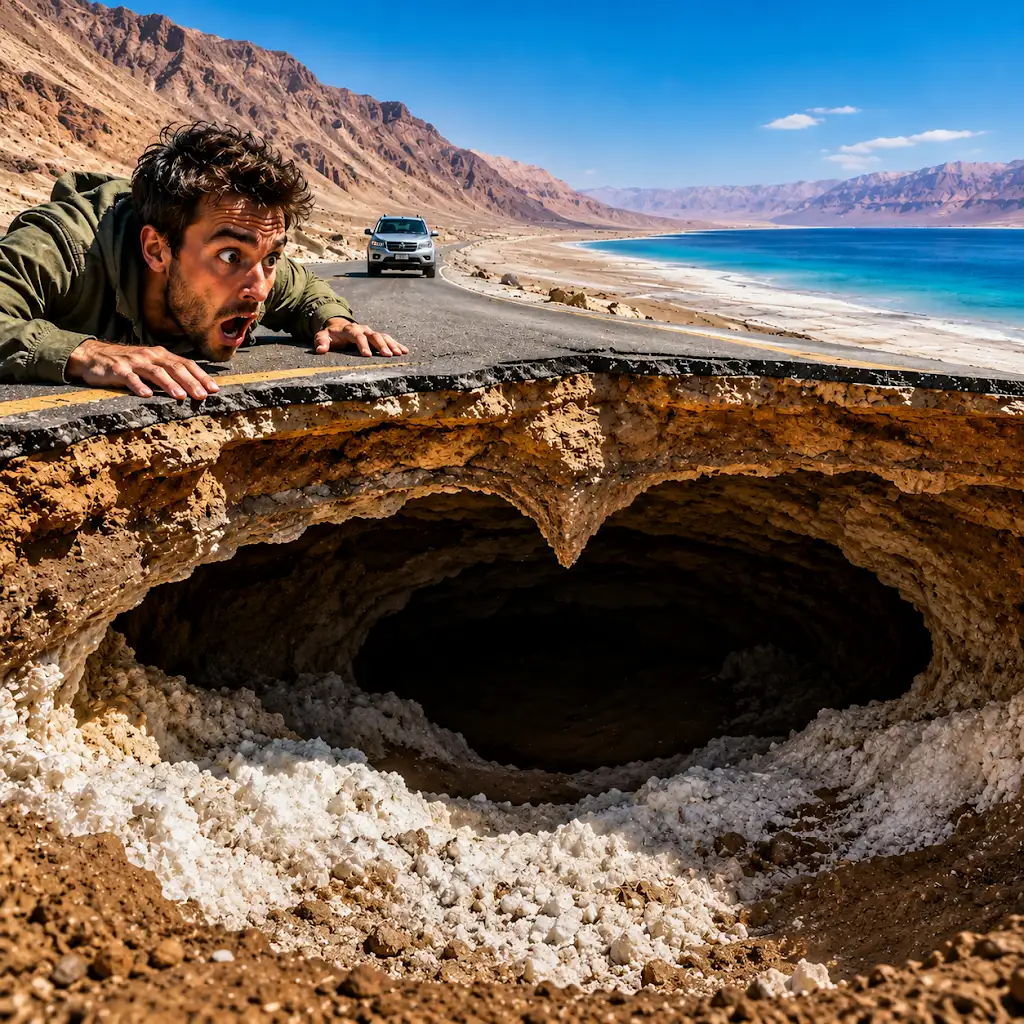
The Dead Sea Is Vanishing — And Leaving Giant Holes Behind
FAQs
What is Dead Sea satellite imagery?
Dead Sea satellite imagery refers to the use of satellite technology to capture high-resolution images of the Dead Sea region from space. These images provide valuable data for studying the environmental changes, water levels, and land use in the area.
How is Dead Sea satellite imagery used?
Dead Sea satellite imagery is used for various purposes, including monitoring changes in the Dead Sea’s water levels, studying the impact of human activities on the surrounding environment, and conducting research on geological and ecological processes in the region.
What are the benefits of using satellite imagery for the Dead Sea?
The use of satellite imagery for the Dead Sea offers several benefits, including the ability to monitor changes in the water levels, track environmental changes over time, and provide valuable data for scientific research and conservation efforts in the region.
Who uses Dead Sea satellite imagery?
Researchers, scientists, environmental organizations, government agencies, and other stakeholders use Dead Sea satellite imagery to study and monitor the region’s environmental changes, water levels, and land use patterns.
Where can I access Dead Sea satellite imagery?
Dead Sea satellite imagery is often available through various sources, including government agencies, research institutions, and online satellite imagery platforms. Some of these images may be freely accessible, while others may require permission or purchase.