
Unveiling the Shifting Landscape of Bangladesh Through Satellite Eyes
Bangladesh, a nation characterized by its intricate network of rivers and its low-lying deltaic geography, is profoundly susceptible to environmental shifts. For decades, these transformations, driven by a confluence of natural processes and anthropogenic pressures, have been shaping the very fabric of the country. While ground-level observations provide crucial insights, they are often localized and time-consuming to collect. It is here that satellite imagery emerges as an invaluable tool, offering a synoptic and historical perspective that allows for the comprehensive monitoring of environmental changes across vast swathes of land and water. By analyzing vast archives of satellite data, researchers and policymakers can glean critical information about the evolution of Bangladesh’s ecosystems, providing a crucial foundation for understanding the challenges it faces and formulating effective adaptation and mitigation strategies. This article delves into the pivotal role of satellite imagery in revealing the dynamic environmental changes that have occurred in Bangladesh over time, examining key areas of transformation and the implications for the nation’s future.
Recent studies utilizing satellite imagery have highlighted significant environmental changes in Bangladesh, particularly in relation to climate change and urbanization. For a deeper understanding of these transformations and their implications, you can explore the article on this topic at MyGeoQuest, which provides valuable insights into how satellite technology is being used to monitor and analyze the environmental landscape of Bangladesh.
Decoding the Dynamics of Coastal Evolution

The coastal zone of Bangladesh, a critical interface between land and sea, is a region of immense ecological and socioeconomic significance. It is also one of the most vulnerable areas to the impacts of climate change, including sea-level rise, increased storm intensity, and coastal erosion. Satellite imagery has been instrumental in documenting these multifaceted changes, providing a consistent and spatially comprehensive record that would be difficult, if not impossible, to obtain through traditional surveying methods.
Tracking the March of Land and Sea: Shoreline Dynamics
One of the most direct applications of satellite imagery in understanding coastal evolution is the precise mapping of shoreline changes. Over time, satellite sensors can delineate the land-sea boundary with remarkable accuracy. This allows for the quantification of coastal erosion – the loss of land due to wave action, currents, and storm surges – and coastal accretion – the deposition of sediment that can lead to land gain. In Bangladesh, satellite data has revealed localized patterns of both erosion and accretion along its extensive coastline. For instance, periods of increased cyclone activity have been correlated with significant shoreline retreat in certain areas, displacing communities and impacting vital mangrove ecosystems. Conversely, in other regions, natural sediment transport from the mighty Ganges-Brahmaputra-Meghna river system, amplified by upstream land-use changes, can contribute to land building, albeit often at rates that may not keep pace with erosional forces. The temporal resolution of satellite imagery, with frequent revisits by satellites like Landsat and Sentinel, allows for the identification of rapid, event-driven changes following major storms, as well as slower, secular trends in shoreline position. This granular understanding is vital for coastal zone management, enabling the identification of high-risk areas that require protective measures or managed retreat.
The Shrinking and Expanding Realm of the Sundarbans
The Sundarbans, the world’s largest contiguous mangrove forest, is a UNESCO World Heritage site and a crucial natural buffer for Bangladesh, protecting millions from storm surges and cyclones. Satellite imagery has provided an unprecedented view of the health and extent of this vital ecosystem over several decades. Analysis of multi-temporal satellite data has shown fluctuations in mangrove cover, often linked to factors such as sea-level rise, salinity intrusion, and human activities. Periods of significant mangrove degradation have been identified, characterized by a reduction in forest density and the disappearance of entire mangrove patches, particularly in the more seaward regions. These changes are often attributed to increased inundation from rising sea levels, increased salinity stress on mangrove species adapted to brackish water, and the encroachment of human settlements and aquaculture into formerly forested areas. Conversely, some areas might show signs of regeneration or expansion, particularly where sediment deposition is favorable and human pressure is lower. The spectral signatures captured by satellite sensors, such as those in the visible and near-infrared bands, can differentiate between healthy, dense mangrove vegetation and degraded areas or open water. More advanced techniques, employing radar imagery, can penetrate cloud cover and provide year-round monitoring, crucial in a region prone to monsoonal rains, allowing for a more continuous assessment of forest health and structure. The long-term trends revealed by satellite imagery are a stark indicator of the ecological pressures on the Sundarbans and underscore the urgent need for conservation and restoration efforts.
The Shifting Sands of River Islands and Chars
Bangladesh’s riverine landscape is dotted with numerous ephemeral and semi-permanent river islands, often referred to as ‘chars’ or ‘islands’. These landforms are created by the deposition of sediments carried by the major rivers and are highly dynamic, prone to both formation and erosion. Satellite imagery offers a unique vantage point to observe the creation, growth, and eventual submergence or erosion of these chars. Historical satellite images, dating back to the mid-20th century, allow for the reconstruction of the evolution of these landforms. Researchers can map the approximate dates of char formation, track their growth in area, and document their disappearance. This dynamic process is influenced by river flow patterns, sediment load, and human interventions such as embankment construction, which can alter natural accretion processes. The vulnerability of char dwellers, often among the poorest and most marginalized populations, to displacement due to the erosion of their homes is a significant humanitarian concern. Satellite imagery helps in identifying these vulnerable areas and understanding the rates of change, which is crucial for planning resettlement programs and disaster preparedness. Furthermore, the emergence of new chars, while potentially offering new land for settlement, also presents challenges related to land tenure and resource management.
Urbanization’s Footprint: Spreading Cities and Strained Resources

Bangladesh has experienced rapid urbanization over the past few decades, with a significant proportion of its population migrating to cities in search of economic opportunities. This demographic shift has led to a dramatic expansion of urban areas, often at the expense of agricultural land and natural habitats. Satellite imagery provides an indispensable tool for monitoring the spatial extent and patterns of this urban sprawl.
Mapping the Growth of Metropolitan Areas
By comparing satellite images taken at different points in time, the outward growth of cities like Dhaka, Chittagong, and Khulna can be meticulously mapped. This process involves classifying pixels based on their spectral characteristics, distinguishing between built-up areas (characterized by high reflectance and impervious surfaces), vegetation, water bodies, and bare soil. The analysis reveals a clear trend of urban expansion, often in a sprawling, uncoordinated manner. This growth is not only in terms of residential areas but also encompasses industrial zones, commercial hubs, and infrastructure development like roads and highways. The spectral signature of concrete, asphalt, and buildings is readily distinguishable from the natural landscape in satellite imagery, allowing for the precise delineation of urban boundaries and the calculation of the rate of expansion. This data is vital for urban planners to understand the scale of development, identify areas under pressure, and forecast future growth trajectories, which is essential for providing adequate services and infrastructure.
The Loss of Green Spaces and Agricultural Lands
The expansion of urban areas is intrinsically linked to the conversion of other land cover types. Satellite imagery clearly illustrates the significant loss of agricultural land and natural green spaces surrounding urban centers. This conversion is driven by the demand for land for housing, industry, and infrastructure. The spectral characteristics of cultivated fields and forests differ markedly from those of urbanized areas, making the identification and quantification of this land-use change straightforward using remote sensing techniques. Analysis of historical satellite data reveals that prime agricultural lands, often fertile floodplains, are being increasingly encroached upon by urban development. Similarly, natural wetlands and wooded areas, which play crucial roles in flood regulation and biodiversity, are being cleared to make way for development. This loss of green cover has profound implications for food security, biodiversity conservation, and the urban environment, contributing to increased heat island effects and reduced air and water quality. The ability to monitor this conversion over time allows for the assessment of the environmental costs of rapid urbanization and the identification of areas where conservation efforts are most needed.
Forests Under Pressure: Deforestation and Degradation Trends
Forests are vital ecosystems, providing essential ecological services, supporting biodiversity, and contributing to climate regulation. In Bangladesh, forest cover has been subject to various pressures, leading to concerns about deforestation and degradation. Satellite imagery has played a crucial role in monitoring the health and extent of these invaluable natural resources.
Quantifying Forest Cover Change
Through the use of sophisticated image processing techniques, satellite imagery can accurately map and quantify changes in forest cover over time. By comparing images from different years, analysts can identify areas where forests have been cleared (deforestation) or where forest quality has declined (degradation). Different types of satellite sensors, including optical and radar, offer complementary information. Optical sensors, like those on Landsat and Sentinel satellites, are sensitive to variations in vegetation cover, canopy density, and health. Radar sensors, capable of penetrating cloud cover, can provide information on forest structure and biomass. Analysis of such data has revealed patterns of deforestation, often concentrated in the hill districts of the country, driven by factors such as agricultural expansion (slash-and-burn cultivation), logging, fuelwood collection, and infrastructure development. The temporal analysis allows for the identification of hotspots of deforestation and the assessment of the rate at which forest cover is being lost. This information is critical for informing forest management policies, developing conservation strategies, and identifying areas in need of reforestation.
The Impact of Fires and Illegal Logging
Satellite imagery can also be used to detect indicators of forest degradation, such as forest fires and evidence of illegal logging. While direct detection of small-scale logging operations can be challenging, larger clearings and the resulting changes in forest structure can be identified. The spectral signatures of burnt areas are distinct in satellite imagery, allowing for the mapping of fire incidents and their extent. Repeated fires can significantly degrade forest ecosystems, leading to a loss of biodiversity and increased soil erosion. Similarly, changes in canopy cover and the presence of uncharacteristic patterns of clearing can be indicative of illegal logging activities. Advanced techniques, such as the use of very high-resolution imagery, can sometimes identify linear features associated with logging roads. The consistent monitoring provided by satellite platforms enables authorities to identify areas prone to these destructive activities and to implement more targeted enforcement measures. Understanding the spatial and temporal patterns of these threats is a crucial step in protecting Bangladesh’s remaining forest resources.
Recent studies utilizing satellite imagery have revealed significant environmental changes in Bangladesh, highlighting the impact of climate change on the region’s landscape. For a deeper understanding of these transformations, you can explore a related article that discusses the various factors contributing to these shifts. The findings underscore the importance of monitoring environmental changes through advanced technologies. To read more about this topic, visit this article.
Water Resources in Flux: Rivers, Wetlands, and the Salinity Challenge
| Year | Forest Cover (sq km) | Water Body Area (sq km) | Urban Area Expansion (sq km) | Coastal Erosion Rate (meters/year) | Flooded Area (sq km) |
|---|---|---|---|---|---|
| 2000 | 10,500 | 8,200 | 1,200 | 1.5 | 3,000 |
| 2005 | 9,800 | 8,000 | 1,600 | 2.0 | 3,500 |
| 2010 | 9,200 | 7,900 | 2,100 | 2.3 | 4,200 |
| 2015 | 8,700 | 7,850 | 2,700 | 2.7 | 4,800 |
| 2020 | 8,200 | 7,800 | 3,300 | 3.0 | 5,200 |
Bangladesh is a water-rich country, heavily reliant on its rivers and wetlands for agriculture, fisheries, and domestic use. However, these water resources are facing significant challenges, including changes in river flow, wetland degradation, and increasing salinity intrusion, all of which are being closely monitored through satellite imagery.
Mapping the Dynamics of River Systems and Wetlands
The intricate network of rivers in Bangladesh, including the mighty Ganges, Brahmaputra, and Meghna, is in constant flux. Satellite imagery allows for the mapping of river channels, their widths, and their meandering patterns over time. This helps in understanding changes in river morphology, sedimentation rates, and the potential for bank erosion or avulsion (sudden change in river course). Similarly, the extent and health of wetlands, which are vital for biodiversity and flood control, can be monitored. Satellite data can distinguish between open water bodies, vegetated wetlands, and areas prone to seasonal inundation. Changes in wetland extent, often due to agricultural conversion, urban development, or altered hydrological regimes, can be clearly observed. The spectral characteristics of water bodies, such as their turbidity and chlorophyll content (indicating algal blooms), can also be assessed using satellite imagery, providing insights into water quality. This continuous monitoring is essential for water resource management, flood forecasting, and the conservation of these critical ecosystems.
The Insidious Spread of Salinity Intrusion
One of the most critical environmental changes impacting Bangladesh, particularly its southern coastal regions, is salinity intrusion into freshwater resources. Driven by sea-level rise, reduced dry-season river flows, and upstream water diversions, saltwater is encroaching further inland, contaminating groundwater and surface water sources. Satellite imagery, particularly that acquired in microwave and thermal bands, can indirectly detect the presence and extent of saline water. For instance, changes in vegetation health and type can be indicative of increased salinity stress, as salt-tolerant species may replace those that are not. Furthermore, by mapping areas prone to tidal inundation during high tides, and by correlating this with rainfall and river flow data, satellite analysis can help delineate zones where salinity intrusion is likely to be most severe. The long-term analysis of these indicators over decades provides a clear picture of the progressive march of salinity inland, impacting agricultural productivity, drinking water availability, and the livelihoods of millions. This information is indispensable for developing adaptation strategies, such as promoting salt-tolerant crops and investing in desalination technologies.
Conclusion: A Digital Window into a Changing Nation
Satellite imagery has unequivocally transformed our understanding of environmental change in Bangladesh. From the subtle shifts in coastlines and the dramatic expansion of cities to the pressure on forests and the insidious spread of salinity, these remote sensing technologies provide an unparalleled, objective, and long-term perspective. The ability to analyze vast archives of data, compare images from different eras, and identify spatial and temporal patterns has moved environmental monitoring from a localized, episodic exercise to a comprehensive, continuous process. This digital window into Bangladesh’s evolving landscape is not merely an academic exercise; it is a critical tool for informed decision-making. Policymakers, conservationists, urban planners, and disaster management agencies can now leverage this rich dataset to identify vulnerabilities, prioritize interventions, and develop effective adaptation and mitigation strategies. As Bangladesh continues to grapple with the multifaceted challenges of climate change and rapid development, the role of satellite imagery in guiding its path towards a more sustainable and resilient future will only grow in importance. The continuous flow of data from orbiting satellites offers a constant vigil, a silent witness to the ongoing transformations of this dynamic nation, and a vital resource for its enduring prosperity and the well-being of its people.
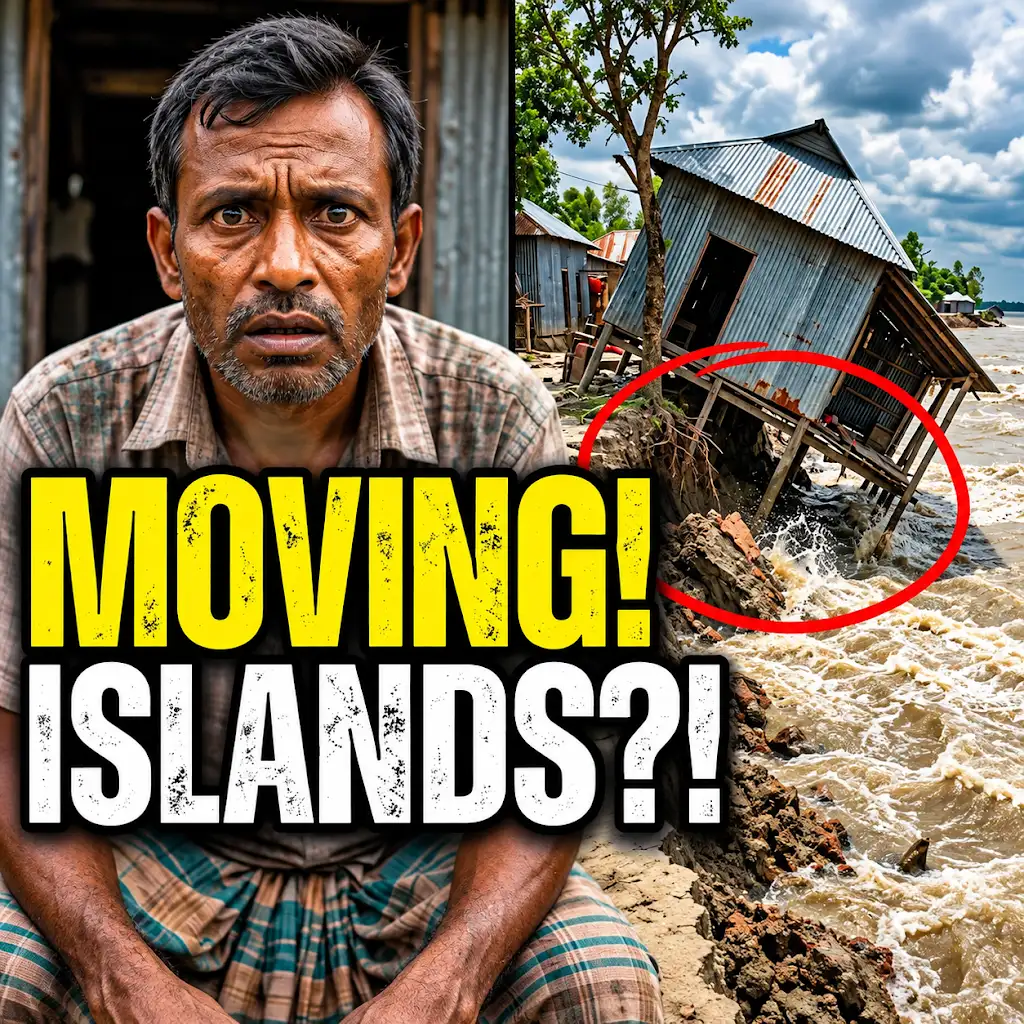
This River is Literally Erasing Islands
FAQs
What is satellite imagery and how is it used to monitor environmental changes in Bangladesh?
Satellite imagery refers to images of the Earth’s surface captured by satellites orbiting the planet. In Bangladesh, satellite imagery is used to monitor environmental changes such as deforestation, urbanization, river erosion, and changes in land use over time.
How has satellite imagery helped in assessing the impact of climate change on Bangladesh’s environment?
Satellite imagery has been instrumental in assessing the impact of climate change on Bangladesh’s environment by providing visual evidence of changes such as sea-level rise, glacial melt, and extreme weather events. This data helps researchers and policymakers understand the extent of environmental degradation and plan for mitigation strategies.
What are some of the key environmental challenges faced by Bangladesh as revealed by satellite imagery?
Some of the key environmental challenges faced by Bangladesh as revealed by satellite imagery include deforestation, coastal erosion, water pollution, loss of biodiversity, and encroachment on natural habitats. These challenges have significant implications for the country’s ecosystems, agriculture, and overall sustainability.
How frequently is satellite imagery updated to track environmental changes in Bangladesh?
Satellite imagery is typically updated on a regular basis, with some satellites capturing images daily, while others may have longer revisit times. The frequency of updates depends on the satellite used and the specific monitoring needs. In the case of tracking environmental changes in Bangladesh, satellite imagery is often updated at intervals ranging from daily to monthly.
Can satellite imagery be used to predict future environmental changes in Bangladesh?
While satellite imagery provides valuable data on current environmental conditions, it can also be used to model and predict future changes in Bangladesh’s environment. By analyzing trends and patterns over time, researchers can make informed projections about potential environmental scenarios and plan accordingly to mitigate risks and adapt to changing conditions.