
The intricate dance of water across the landscape has sculpted some of Earth’s most compelling geological features. Among these, braided river channel systems stand out for their dynamic complexity and captivating visual patterns. These systems, characterized by a network of intersecting and diverging channels separated by vegetated or unvegetated islands (called “bars”), are prevalent in environments with high sediment loads and fluctuating water levels. Understanding and visualizing these systems is crucial for a multitude of disciplines, from hydrology and geomorphology to ecological studies and engineering. This article explores the fundamental principles and the diverse array of techniques employed in the visualization and mapping of braided river channel systems.
Unraveling the Anatomy of Braided Rivers
Braided rivers are not merely random arrangements of watercourses. They are the result of specific geomorphic processes that dictate their formation, evolution, and characteristic appearance. A deep understanding of these underlying principles is the bedrock upon which effective visualization and mapping strategies are built.
The Forces Driving Braiding
The primary drivers behind the formation of braided river channels are a confluence of factors related to flow dynamics and sediment transport. High sediment supply is paramount; rivers carrying a substantial amount of sand, gravel, and other unconsolidated material are more prone to braiding. This sediment acts as a building block for the bars that subdivide the channel. Coupled with this is a high flow variability. Periods of high discharge, often associated with snowmelt or heavy rainfall, transport large volumes of sediment, while lower flow periods allow for deposition and the stabilization of bars. The slope of the riverbed also plays a role; steeper slopes generally lead to higher flow velocities and greater sediment transport capacity, promoting braiding. Conversely, flatter slopes can lead to slower flow and increased deposition, further encouraging channel splitting. The width-to-depth ratio of the river is also significant; wider and shallower channels are more susceptible to braiding as the flow is more easily divided and obstructed by incoming sediment. The constant interplay of erosion and deposition, driven by these forces, creates the ever-shifting mosaic of channels and bars that defines a braided system.
Identifying Characteristic Features
The visual signature of a braided river is its most recognizable attribute. Key morphological elements help geomorphologists and hydrologists identify and delineate these systems. The most prominent feature is the presence of multiple, actively migrating channels. These channels are often shallow and sinuous, branching and rejoining frequently. Between these channels lie bars, which can range in size from small, ephemeral sand patches to large, stable islands covered with vegetation. These bars are critical in the braiding process, acting as obstacles that divert flow and initiate new channel development. The scale of braiding can vary dramatically, from small-scale features within a few tens of meters to extensive, kilometer-wide networks. The spatial arrangement of these channels and bars is dynamic, with bars growing and eroding, and channels shifting their positions over time. Understanding the hierarchy of these features – from individual bar development to the overall network morphology – is essential for accurate mapping and interpretation.
For those interested in exploring the complexities of braided river channel systems, a related article that delves into advanced visualization mapping techniques can be found at MyGeoQuest. This resource provides valuable insights into the methodologies used to analyze and represent the dynamic nature of braided rivers, enhancing our understanding of their geomorphology and ecological significance.
Capturing the Form: Remote Sensing and Aerial Survey Methods

The vastness and dynamic nature of braided river systems often preclude direct, on-the-ground measurement as the sole means of study. Remote sensing and aerial survey techniques offer powerful tools for capturing the spatial extent and detailed morphology of these complex environments. These methods provide synoptic views and enable continuous monitoring over time.
Satellite Imagery: A Bird’s-Eye View
Satellite imagery has revolutionized our ability to map and monitor large-scale geomorphic features, including braided rivers. Different spectral bands and resolutions offer varying levels of detail and information. Optical imagery, such as that from Landsat or Sentinel satellites, is invaluable for identifying the broad patterns of channels and bars, particularly in areas with distinct vegetation cover that highlights the stable islands. Multispectral capabilities allow for differentiation between water bodies, sediment deposits, and vegetation, aiding in the delineation of channel boundaries and bar extents. Higher-resolution commercial satellite imagery, like that from WorldView or Planet, can provide even finer details, revealing individual bar morphology and even smaller channel features. Radar imagery, while less intuitive visually, can penetrate cloud cover and is sensitive to surface roughness, which can be useful for distinguishing water from dry sediment bars, especially in regions with frequent cloud cover. Time-series analysis of satellite imagery is particularly powerful, allowing researchers to track changes in channel patterns, bar migration, and overall system evolution over months, years, and even decades. This temporal dimension is crucial for understanding the dynamic processes at play in braided rivers.
Aerial Photography and Photogrammetry: High-Resolution Details
Aerial photography, often captured from manned aircraft or drones, offers even higher spatial resolution than most satellite imagery, providing unparalleled detail of braided river systems. Traditional aerial photographs, when taken with sufficient overlap, can be processed using photogrammetric techniques to create detailed three-dimensional models. Drones (Unmanned Aerial Vehicles or UAVs) have emerged as particularly versatile tools. Their ability to fly at low altitudes and capture imagery on demand allows for highly detailed and frequent surveys of specific river reaches. Drones equipped with high-resolution RGB cameras, multispectral sensors, or even LiDAR (Light Detection and Ranging) can generate precise orthomosaic imagery and digital elevation models (DEMs). Photogrammetry allows for the extraction of accurate planimetric (2D) and topographic (3D) data, enabling the precise measurement of channel widths, bar dimensions, and elevation differences. This level of detail is critical for geomorphic analysis, hydrological modeling, and ecological habitat assessment within the braided system.
LiDAR: Unveiling the Topography Beneath Vegetation
Light Detection and Ranging (LiDAR) is a remote sensing technology that uses laser pulses to measure distances to the Earth’s surface. This creates highly accurate three-dimensional point clouds, which can be processed into precise DEMs. For braided rivers, LiDAR is particularly valuable because its laser pulses can penetrate vegetation canopies, revealing the underlying ground surface topography. This is a significant advantage in vegetated braided systems where optical imagery might obscure the true extent and shape of channels and bars due to dense foliage. Airborne LiDAR surveys can cover large areas efficiently, providing a consistent and high-resolution topographic dataset. This data is essential for understanding flow paths, identifying potential flood inundation zones, and analyzing the micro-topography that influences vegetation establishment and ecological processes within the braided environment.
Ground-Truthing and In-Situ Data Collection

While remote sensing provides broad coverage and high-level detail, ground-truthing and in-situ data collection are indispensable for validating remote sensing data, acquiring finer-scale information, and understanding the processes that cannot be directly observed from above. These direct observations are crucial for building a comprehensive understanding of braided river dynamics.
Field Surveys and Measurements: The Tangible Reality
Direct fieldwork allows for the collection of precise measurements that complement and validate remote sensing data. This includes conducting topographic surveys using GPS receivers and total stations to map channel thalwegs, bar crests, and inter-channel areas with centimeter-level accuracy. Sediment sampling is vital to characterize the grain size distribution of bed material, which directly influences channel morphology and stability. Measurements of flow velocity and depth at various points within the channels provide critical hydrological data. Researchers can also document vegetation types and cover, which are important indicators of bar stability and habitat suitability. Geomorphological mapping in the field allows for the identification of active erosion and deposition zones, scour features, and the textural characteristics of different bar surfaces. This direct interaction with the river system provides an invaluable layer of understanding that is often not fully captured by remote methods alone.
Acoustic Doppler Current Profilers (ADCPs): Measuring Flow Dynamics
Acoustic Doppler Current Profilers (ADCPs) are sophisticated instruments used to measure water velocity in rivers. ADCPs use the Doppler effect to determine the speed and direction of water flow in multiple depth cells simultaneously. They can be mounted on a boat, a float, or a fixed platform. In braided river systems, ADCPs are used to understand the complex flow patterns within and between channels. They can reveal how flow splits and converges, the velocity variations across the channel width, and the presence of recirculation zones or areas of reduced flow velocity. This detailed hydrological data is essential for understanding sediment transport dynamics, identifying areas prone to erosion or deposition, and evaluating the hydraulic connectivity between different parts of the braided network. Combining ADCP data with bathymetric surveys allows for the creation of detailed hydrodynamic models.
Sediment Transport Monitoring: Quantifying the Movement
Directly monitoring sediment transport is crucial for understanding the forces that shape braided rivers. This can involve a variety of techniques, from simple visual observations to sophisticated instrumentation. Bedload traps can be deployed to collect the coarse sediment transported along the riverbed. Suspended sediment concentration can be measured using sediment samplers or continuously monitored with turbidity sensors. Tracer studies, where known quantities of sediment particles (often painted or tagged) are introduced into the river, can help track sediment movement and residence times. Understanding the volume, size, and rate of sediment transport provides direct insight into the river’s ability to build and erode bars, and therefore, to maintain its braided form. This quantitative data is essential for validating geomorphic models and predicting future channel behavior.
Digital Visualization and Cartographic Representation
Once data is collected, the challenge shifts to effectively visualizing and representing the complex geometry and dynamics of braided river systems. This involves employing a range of cartographic techniques and digital tools to create informative and interpretable maps and visualizations.
Digital Elevation Models (DEMs) and Topographic Mapping
Digital Elevation Models (DEMs) are fundamental to the visualization of braided river systems. Derived from LiDAR, photogrammetry, or ground surveys, DEMs provide a continuous digital representation of the terrain’s elevation. From DEMs, various derivative products can be generated to highlight specific geomorphic features. Hillshade visualizations create realistic depictions of topography by simulating illumination, making channel and bar forms visually prominent. Slope and aspect maps reveal the steepness and orientation of the terrain, which can inform interpretations of erosion and depositional processes. Contour lines, when generated from high-resolution DEMs, can precisely delineate channel boundaries and bar elevations. The ability to manipulate and visualize DEMs in three dimensions allows for a deeper understanding of the volumetric characteristics of the braided landscape.
Orthomosaics and Georeferenced Imagery: Spatial Context
Orthomosaics are georeferenced, geometrically corrected images created by stitching together multiple aerial or satellite photographs. This process removes distortions caused by camera tilt and terrain relief, resulting in a map-accurate representation of the braided river system. Georeferenced orthomosaics provide an invaluable visual backdrop for other spatial data layers, such as DEM-derived products or field survey points. They allow for the direct interpretation of land cover, vegetation patterns, and the fine-scale morphology of channels and bars. Overlaying historical orthomosaics with current ones allows for the visualization of channel migration and bar evolution over time, providing a powerful tool for understanding the dynamic nature of braided rivers.
3D Modeling and Virtual Fly-throughs: Immersive Understanding
Advanced visualization techniques go beyond static maps to create immersive experiences. Three-dimensional (3D) models of braided river systems can be generated from DEMs and orthomosaics, allowing users to explore the terrain interactively. Virtual fly-throughs, where a simulated camera navigates through the 3D model, offer a compelling way to convey the scale and complexity of the braided landscape. These visualizations can be used for educational purposes, public outreach, or for detailed analysis by researchers. By incorporating dynamic elements, such as simulated water flow or sediment transport, these 3D models can provide even greater insight into the processes at play. This visual immersion can facilitate a more intuitive understanding of the intricate spatial relationships within a braided river network.
In recent studies, the visualization and mapping of braided river channel systems have gained significant attention due to their complex dynamics and ecological importance. A related article that delves into advanced techniques for understanding these unique river systems can be found at this link. By employing innovative mapping methods, researchers aim to enhance our comprehension of sediment transport and habitat diversity within braided rivers, ultimately contributing to better management practices for these vital ecosystems.
Applications and Interpretations of Braided River Mapping
| Metric | Description | Typical Range | Measurement Method | Relevance to Visualization |
|---|---|---|---|---|
| Channel Width | Average width of individual braided channels | 10 – 100 meters | Remote sensing imagery analysis, field surveys | Defines scale and resolution of channel features in maps |
| Number of Braids | Count of active channel threads within the braided system | 3 – 20 channels | Satellite image interpretation, aerial photography | Indicates complexity and density of the braided network |
| Channel Sinuosity | Ratio of channel length to straight-line distance | 1.0 – 1.5 | GIS mapping and spatial analysis | Helps in understanding flow patterns and channel dynamics |
| Bar Area Percentage | Proportion of exposed sediment bars within the channel system | 20% – 60% | Image classification and segmentation techniques | Highlights sediment deposition zones and channel stability |
| Flow Velocity | Average water flow speed in braided channels | 0.5 – 3 m/s | In-situ flow meters, hydrodynamic modeling | Influences sediment transport and channel morphology |
| Elevation Variation | Difference in elevation between channel bed and bars | 0.5 – 5 meters | LiDAR surveys, topographic mapping | Critical for 3D visualization and flood risk assessment |
| Temporal Change Rate | Rate of change in channel pattern over time | Variable; measured in meters/year | Time-series satellite imagery comparison | Assesses channel dynamics and stability for monitoring |
The detailed mapping and visualization of braided river channel systems are not merely academic exercises. They underpin a wide range of practical applications that address critical environmental, ecological, and engineering challenges.
Hydrological Modeling and Flood Risk Assessment
Accurate maps of braided river channels are fundamental inputs for hydrological models. These models simulate water flow, sediment transport, and flood inundation. The detailed geometry of channels, the elevation of bars, and the extent of the braided network all influence how water will flow during high discharge events. DEMs derived from mapping efforts are crucial for determining water surface elevations and flow paths during floods. Identifying areas prone to inundation within the complex inter-channel areas is a key outcome of flood risk assessment. Understanding the capacity of the braided system to convey floodwaters is vital for developing effective flood mitigation strategies, land-use planning, and emergency response protocols. The dynamic nature of braided rivers also necessitates frequent updates to these models and maps to ensure their continued accuracy.
Ecological Habitat Characterization and Management
Braided river systems provide diverse and dynamic habitats for a wide range of aquatic and terrestrial species. The mosaic of channels, bars, and riparian vegetation creates a complex environmental gradient. Mapping these features allows ecologists to characterize different habitat types, such as shallow riffles, deeper pools, vegetated bars, and bare sediment areas. This information is crucial for understanding species distribution, identifying critical breeding or feeding grounds, and assessing the impact of environmental change or human activities on biodiversity. Effective management plans for threatened or endangered species often rely on detailed maps of their preferred habitats within braided river systems. Understanding the connectivity between different parts of the braided network is also important for species movement and dispersal.
Geomorphic Research and Predictive Modeling
For geomorphologists, detailed maps and visualizations are the primary tools for studying river evolution and predicting future changes. By comparing maps from different time periods, researchers can quantify rates of channel migration, bar accretion and erosion, and overall changes in the braided network. This data is used to develop and refine conceptual and numerical models of braided river dynamics. These models can help answer fundamental questions about why rivers braid, how sediment supply influences morphology, and how river systems respond to changes in climate or land use. The ability to visualize potential future channel configurations based on these models is invaluable for long-term planning and management of these dynamic landscapes.
In conclusion, the visualization and mapping of braided river channel systems represent a sophisticated interplay of remote sensing, in-situ data collection, and advanced digital processing. From the broad strokes captured by satellites to the fine details revealed by LiDAR and ground surveys, each technique contributes a vital piece to the puzzle. The resulting digital representations, whether as static maps or dynamic 3D models, not only illuminate the intricate beauty of these rivers but also provide the essential data for understanding their complex hydrological, ecological, and geomorphic processes, ultimately informing critical decisions for their management and preservation.
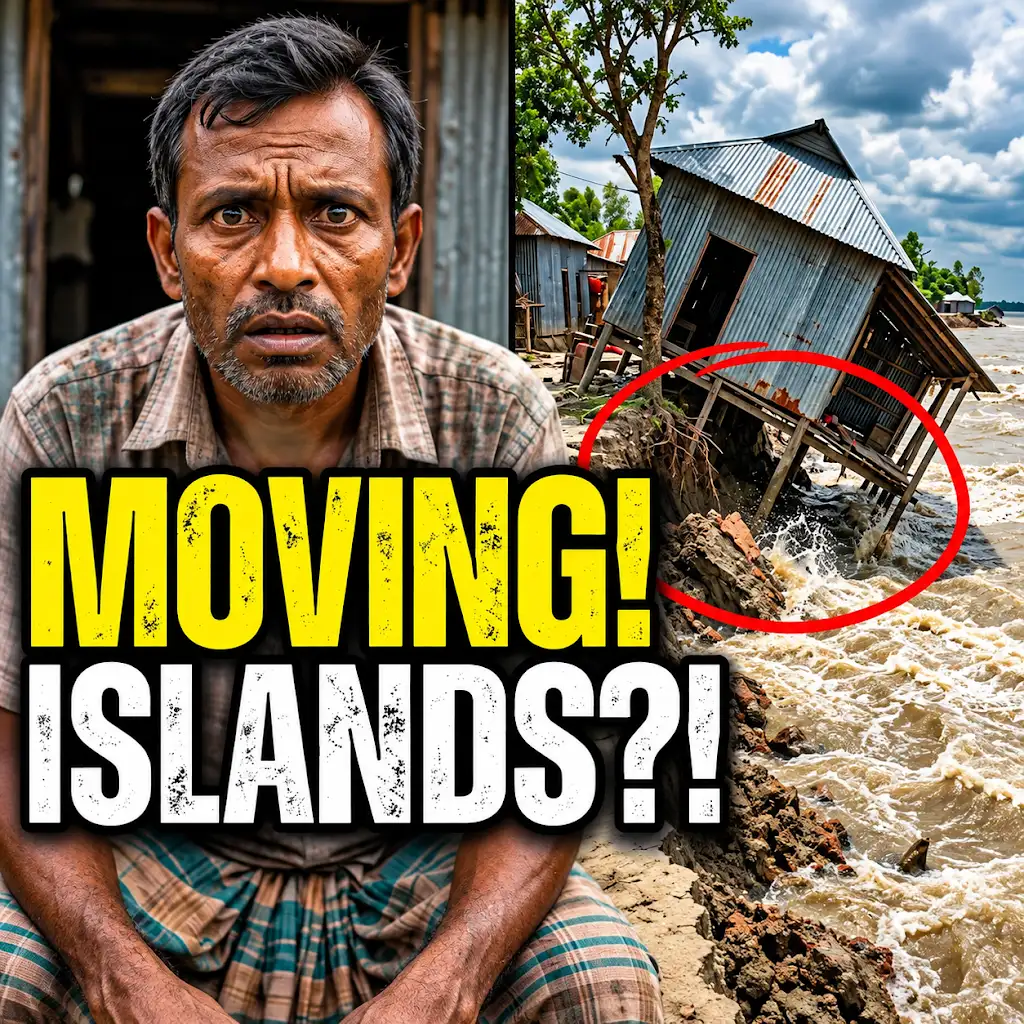
This River is Literally Erasing Islands
FAQs
What is a braided river channel system?
A braided river channel system is a network of interconnected channels that constantly shift and braid together due to high sediment loads and variable flow rates.
How is a braided river channel system different from a meandering river?
A braided river channel system has multiple interconnected channels that frequently split and rejoin, while a meandering river has a single, sinuous channel that curves back and forth.
Why is visualization mapping important for studying braided river channel systems?
Visualization mapping allows researchers to create detailed visual representations of the complex channel patterns, sediment deposits, and flow dynamics within braided river systems, aiding in understanding their behavior and evolution.
What technologies are commonly used for visualizing and mapping braided river channel systems?
Technologies such as aerial photography, satellite imagery, LiDAR (Light Detection and Ranging), drones, and GIS (Geographic Information Systems) software are commonly used for visualizing and mapping braided river channel systems.
How can the mapping of braided river channel systems benefit environmental management and planning?
Accurate mapping of braided river channel systems can help in predicting flood risks, managing sediment transport, preserving habitats, and making informed decisions for land use planning and conservation efforts in riverine environments.